The First Design Cycle
Initial design of the observation protocol began by watching videos of high school mathematics classrooms that had high amount of in-class student work. As we watched the video, we began to record student behaviors that we found relevant to the question of measuring students’ use of resources to resolve a problem. This list was then supplemented with behaviors that we had observed in our own experience. This list of behaviors became our open codes:
Teacher identifies resources
Teacher provides instruction on use of resources
Teacher does not create opportunities for other resources (lecture/quiz/etc)
Teacher answers question that could have be redirected to class/student
Student asks for more student-student interaction
Student asks for more work time
Student requests information on resources
Student requests instruction on use of resources
Student asks question of teacher
Teacher creates opportunities for students to ask questions of each other
Teacher asks open-ended question
Students ask questions of each other
Students share observations with other students
Students observe and learn from each others’ approaches to problems
Student builds on another student’s comment
Student challenges another student’s comment
Student expresses uncertainty to another student
Student waits for teacher to come along to solve the problem
Internet access restricted
Student passively uses assigned resource (read text/watch video)
Internet access made available
Teacher provides students with control of reference (textbook/video/etc).
Teacher assigns creation of reference (journal/wiki/etc).
Student reviews textbook
Student reviews video tutorial
Student flips back in notes/handout
Student reviews student created reference
Students create connections in student created reference
Student uses website
Student suggests or brings in resource
Student asks metacognition/reflection questions
Student connects problem to out of classroom experience.
Student demonstrates intrinsic motivation to learn material
Student creates a sub-problem for themselves
Student reorganizes or re-represents the problem (ex: draws a diagram)
Student categorizes problem by underlying mathematical principle
Student makes their own observations beyond what is planned by the teacher
Student makes their own problems beyond what is planned by the teacher
Student proposes an experiment
Initial axial coding and first trial coding
Our initial organization of the data involved classifying the open codes into major categories based on who the actors were, and sub-categories based on the type of interaction:
Student-Teacher
Teacher identifies resources
Student requests instruction
Student-Student
Teacher opens collaboration
Students share observations
Students ask questions of each other
Students observe each other
Students (build on/challenge) each other’s comments
Student expresses uncertainty to another
Student-Reference
Student uses external reference
Student-Internal
This initial coding scheme was used to code classroom video from the Trends in International Mathematics and Science Study (TIMSS) website. The videos were coded using a form designed in the iCoda iPad app. iCoda is software tool for field observation in which a form consists of “buttons.” Whenever an event corresponding to a code is observed to start, a button is pressed to activate it, and then pressed again to deactivate the button. iCode records the start time, end time, and title for all buttons pressed during an observation. Early versions of our form no longer exist, but a sample later version can be seen in Figure 6. The resulting data was studied using analysis software written in-house by the authors.

Figure 1: Example code histogram of code frequencies (counts)
![]()
Figure 2: Sample timeline showing the time of occurrence of each code during the class video. Vertical axis is code (in the same order as the histogram in figure 1). Horizontal axis is time.
Second axial coding and first trial coding
During this design cycle and discussion, a second way of organizing the codes emerged, which led to a second axial coding of the codes. We decided that scoring a class based on student actions wasn’t reasonable in situations where the instructor didn’t give the students an opportunity to act. For example, in the timeline above (Figure 1), you can see a long period of time at the beginning of the class when the teacher is introducing the problem (The leftmost black bar representing “student-teacher” interaction).
In this second organizing scheme, we placed the observed behaviors in two dimensions. The dimension was our original top-level category of the actors, while the second dimension was based what kinds of opportunities the students had to use resources, and whether or not they took those opportunities. The new axial coding scheme looked something like (Figure 3).
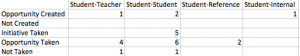
Figure 3: Table of results for two-dimensional axial coding

Figure 4: Count histogram under two-dimensional axial coding scheme
![]()
Figure 5: Example timeline under two-dimensional axial coding scheme.
The Second Design Cycle
After the initial design cycle, we found that there was a dissonance between focusing on pairs of actors in one dimension, and opportunities in the second dimension because opportunities involved only a single actor. We redesigned the codes to combine these two categories into a single resources dimension.
Teacher is resource
Teacher points to resource
Student uses teacher
Student uses student
Student uses object
However, we still wanted to make a commentary on quality of content, so we added a new second dimension based on Depth of Knowledge (DoK) levels in an attempt to track when students were relying on the teacher for simple recall situations or when their need required more analysis or deeper thinking. The resulting iCoda form can be seen in Figure 6.

Figure 6: iCoda form for cycle 2. Each button corresponds to a code. The observer presses a button to activate the code, and again to release the button, and iCoda records start and end times.

Figure 7. Comparison of count and duration histograms for the same class, showing very different pictures of the classroom.
We began to observe a large number of overlapping event instances; this meant that our initial approach of counting code instances was not viable. Because each button only had an on-off state, overlapping instances would be recorded only as a single event. For example students asking for help often overlapped with each other, leading to a misleadingly low count of student’s asking for help. We compensated for this by making a move to tracking the duration of a code rather than counting instances (Figure 7). This showed us a very different picture of the classroom, where the students spend a lot of time waiting for the teacher to come help them.
A second problem was the interface of the redesigned form. Decisions identifying actors could be made very quickly, (as soon as the actor began speaking), while decisions about depth of knowledge required more insight into the content. This led to a time lag where the observer would often know which code to choose in the resources dimension long before they knew which DoK level was appropriate to code for. After this iteration and the challenges presented by the additional coding of DoK, the decision was made to remove this feature from the coding.

Figure 8: Redesigned iCoda form separating the two dimensions to account for time lag.
The Third Design Cycle
At this point, our codes became relatively fixed. The third design cycle was primarily about negotiating the meanings of individual codes. Due to the limited number of TIMSS videos, we moved to coding classroom video from two high school algebra classes in Arizona.
![]()
Figure 9: Sample inter-rater reliability analysis for code “Student uses Student.” Blue bars are the codes by the two raters. Black represents times where raters agree there is no code. Green represents times when raters agree there is a code. Orange and magenta represent times of disagreement when only one rater coded. This particular example shows 49.082% agreement between coders.
Initial inter-rater reliability tests with the form had low ratings (Figure 9). We returned to the video to explore times when the coders disagreed and began negotiating the meanings of codes.
Teacher is resource:
The primary disagreement here was whether teacher is resource was only lecture, or whether a teacher responding to a question from a student counted as teacher is resource. Essentially the disagreement was about whether teacher as resource must always be teacher initiated. We decided for the later option: That any time a teacher acted as a source of information, the teacher was acting as a resource, regardless of who initiated it.
Teacher points to resource:
The primary disagreement here was whether assigning an activity that required a tool (such as a calculator) counted as teacher points to resource, because students were expected to use (and be introduced to) the tool. Unlike the case above, we decided that teacher points to resource needs to be defined as the teacher suggesting the use of a tool that was not part of a lesson. For example, if a lesson is set up in such as way that the student is expected to use a graphing calculator as a means to solving a problem, we would not code this as “teacher points to resource.” We would, however, code the use of a graphing calculator as “teacher points to resource” if the calculator was not part of the lesson plan.
Fourth Design Cycle
In our third trial, we tested both the electronic form and a new paper form (Figure 10). The paper form was used as a checklist. During observations, the observer kept a timer, and every minute would check the boxes corresponding to any code events during that minute. The paper form also had a section for the observer to write notes on their observations.

Figure 10. Sample paper form, showing timeline and accompanying notes.
The team universally preferred the paper form for three reasons. First, coding minute by minute instead of second by second gave the team more time to think and analyze while coding. Second, the paper form allowed for the creation of a timeline without specialized software; and third, the team liked the opportunity to add notes to the timelines. These notes served as both explanations for an observer’s’ particular choice of code, and reminders to the observer of what happened for future discussion. The paper form became the sole tool used to gather date during the final inter-rater reliability run.


